Moscow has big plans for office space. Discussions about the future of the market involve millions of square meters, and new business complex projects are popping up one after another around Moscow City. For the city, this means jobs and the redevelopment of former industrial areas. For tenants, it means hope for more choice. For the owner of a small office in a future skyscraper, there’s a very specific question: how many similar spaces will hit the market at the same time as his own?
The main risk of the new cycle is a mismatch between construction timelines and actual demand. A building may be sold out long before construction is completed, but that doesn’t mean companies will move in once it’s ready. Conversely, a large volume of vacant square meters in the statistics doesn’t guarantee that businesses will quickly find a suitable, fully finished floor.
Consultants define “net absorption” as the change in the volume of occupied office space over a given period. This metric helps distinguish market expansion from relocations: if a company vacates one office and occupies another of the same size, a new transaction has occurred, but there may be no net increase in occupied square meters citywide.
Key points at a glance:
By 2030, the market will undergo several tests: from the proposed project to the occupied office.
1. Seven million square meters: what exactly has been promised to the market
The figure sounds impressive. The page for the October CORE.XP webinar, “How Will the Office Market Change by 2030?” lists 7 million square meters, while the agenda indicates a discussion of construction scenarios ranging from 5 to 7 million square meters. This phrasing alone makes it clear that we’re talking about possible trajectories, not a volume that is guaranteed to materialize by a specific date.
In a CORE.XP study published by OFFICE NEWS, the projected supply for 2026–2030 is estimated at 7.3 million square meters. Of this, 3.6 million square meters, or 49%, were still in the design phase. Taking into account the readiness of the projects, consultants estimated the potential supply at less than 5.6 million square meters. These figures describe the entire office construction portfolio under review; it cannot automatically be classified exclusively as Class A. A CORE.XP study on construction timelines.
Hence the first caveat regarding the striking term “doubling.” To use it, one must take the existing stock of a specific class as of a specific date and compare it with future growth within the same timeframe. One cannot simply add all of Moscow’s planned office space to today’s Class A stock. Nor can one substitute office space for the total floor area of mixed-use complexes, as the latter includes other functions, technical facilities, and parking garages.
The comparison—"in four years, as much will be built as in the previous twenty"—also requires a consistent historical baseline. Until such data is provided, this remains a bold hypothesis for discussion, not an established fact. The sheer scale of the construction boom resulting from this amendment remains substantial.
Where the presentation ends and the proposal begins
There are several steps between an announcement and a functioning office. The site must undergo the necessary approvals, and the project must obtain a building permit. Then come financing, a contractor, utility connections, completion of construction, and occupancy. This is often followed by renovating the premises and relocating employees.
These stages have varying levels of evidentiary weight. A rendering illustrates the concept. A permit indicates the ability to build within established parameters. Site photos show the progress of construction. A contract with a corporate client indicates concrete interest in the future property. But none of these indicators, taken alone, can replace the others.
Therefore, talk of “paper towers” is useful only if it is backed up by verification of the project’s current stage. Being in the design phase is normal in itself: every building exists initially only on paper. The risk arises when the deadlines mentioned in promotional materials are approaching, yet there is still little evidence of tangible progress through the construction cycle.
What the most recent comparable years show
The IBC Real Estate report for the fourth quarter of 2025 provides the following data for Moscow. The data covers Prime, A, B+, and B− classes, not just Class A.
| Indicator | 2024 | 2025 |
|---|---|---|
| New office space delivered, thousand square meters | 589 | 748 |
| Net absorption, thousand square meters | 1,227 | 629 |
| Transaction volume, thousand square meters | 2,266 | 1,396 |
| Vacancy rate | 4.8% | 5.3% |
Source: IBC Real Estate, Q4 2025, p. 7. Historical figures are taken from a single version of the report: when updating the database, consultants may revise previous periods.
In 2024, occupied space grew faster than new supply. In 2025, the ratio changed. This is not yet a crisis, but it is already a reason to stop applying the recent shortage to any future project.
A snapshot from September 2026 adds an important detail. According to CORE.XP data published by OFFICE NEWS, the overall vacancy rate reached 7.3%, yet in Class A there were only two move-in-ready units larger than 5,000 square meters—totaling 20,800 square meters. This is an independent sample from another consultant: it is incorrect to combine it with the IBC data into a single continuous trend.
“An increase in vacancy rates does not in itself mean that tenants have more suitable options for relocating,” notes Marina Zhukova of CORE.XP in a published commentary. Data and commentary from CORE.XP.
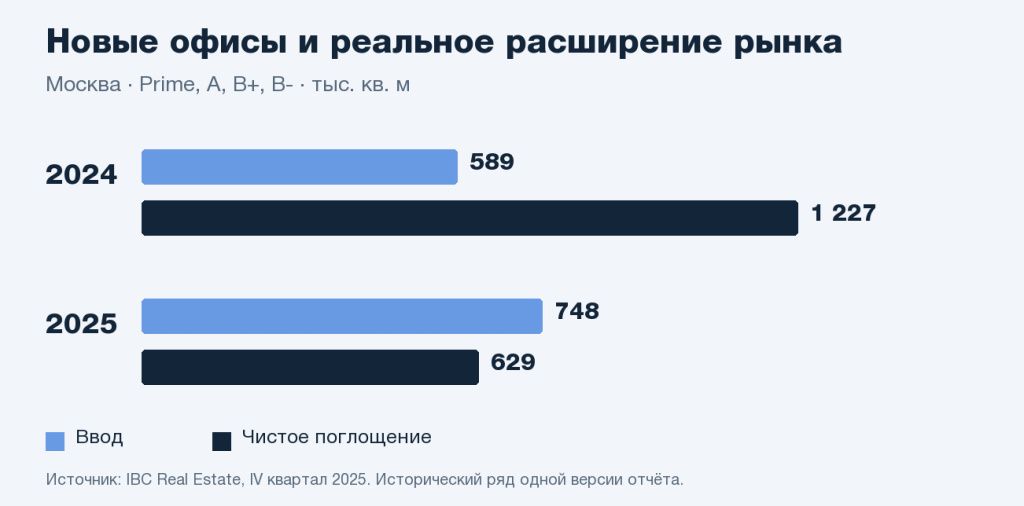
Moscow, Prime, A, B+, and B− classes. New supply and net absorption are different metrics; unit of measurement—thousands of square meters. Data from IBC Real Estate, Q4 2025 report.
2. Lessons from 2015 and the Pandemic: Why the Same Vacancy Rate Means Different Things
The Moscow market has already experienced periods when new buildings came online amid weakening demand. But a single inaccurate figure can easily undermine a historical analogy.
In Cushman & Wakefield’s December 2015 review, available in the CMWP archive, the vacancy rate was estimated at 20.1% for the market as a whole and approximately 31% in Class A. The authors noted that many transactions were accompanied by the vacating of older offices, sometimes with a reduction in occupied space. Therefore, the number of leases did not indicate a rapid disappearance of vacant space. CMWP archive review.
The pandemic situation is different. The shift of employees to working from home was not always accompanied by lease terminations: a physically vacant floor could remain paid for and not be classified as an open vacancy. In CBRE’s 2020 review, the vacancy rate for Moscow City stood at 12.3% at the end of the year; the increase in the final quarter was attributed, in part, to the emergence of new supply. This is a local snapshot, not representative of all of Moscow. CBRE’s 2020 review.
Thus, the frequently cited comparison of “18% in 2015 and 16% during the pandemic” cannot be used as a ready-made risk scale. Without specifying the consultant, asset class, time period, and geographic area, it creates the appearance of comparability where it may not exist.
For the current cycle, another lesson is more relevant: the market is capable of both generating transactions and accumulating vacant space. Let’s consider a company that is moving from three old offices into a single new headquarters. For the new building, this is a successful occupancy. For the former owners, it means a search for tenants. In Moscow, the outcome depends on whether the company’s total floor space has increased and who has moved into the vacated spaces.
A strong project can succeed even in a weak market. But this does not mean that neighboring properties will follow suit—especially if everyone is counting on the same group of large tenants.
The current cycle is worth examining from another angle—through the lens of ownership structure. When offices are sold in separate blocks, the task of finding tenants after completion falls to a multitude of owners with varying financial capabilities. One might be willing to wait a year for the right rent, while another needs income immediately. Competition arises within a single building, not just between towers.
3. Why Offices Are Being Built Even With the Risk of an Overheated Market
There are several motivations behind construction. Expected rental income is just one of them. A corporation may commission an office for its own use, an investor may acquire an asset for the long term, and a residential developer may factor the office component into the economics of a larger project.
Moscow’s mechanisms for supporting the creation of employment opportunities—known as MPT—play a significant role here. They link residential construction to the creation of jobs and infrastructure. In cases provided for by the agreements, fulfilling these obligations allows for a reduction in land-related payments associated with the housing project—specifically, the fee for changing the permitted use of the plot or the corresponding rent. The terms depend on the specific legal and contractual framework. Moscow Government Resolution No. 3135-PP.
For the developer, this changes the calculation. If we consider an office building on its own, the payback period may seem long. When combined with a residential project, however, the effect of tax incentives is also taken into account. Therefore, the decision to build may still be viable even when the rental outlook no longer appears unconditionally strong.
This does not mean that every project under the MPT is inherently unnecessary. The city is addressing its own goal: jobs must be created not only in the historic center. In neighborhoods with a large volume of new housing, offices can become the missing piece of daily life—with services, cafes, and shorter commutes.
But the incentive to build a structure and a business’s willingness to pay for space are two different things. The incentive affects the developer’s costs. It does not replace an assessment of effective demand at a specific address. Nor does it provide the buyer of a specific unit with an automatic guarantee of income.
The mechanism has another consequence: the construction schedule may be tied to commitments under a larger project. In such cases, decisions regarding timelines are not based solely on current vacancies in nearby business centers. Several similar complexes may enter the market within a short timeframe, even if an individual landlord would prefer to wait.
When reading the promise that “the area is assured of future demand,” it’s helpful to ask a simple question: Is this demand from companies that have signed contracts, or is it based on future residents and the area’s development? The second option also has merit. It’s just that the timeframe and level of uncertainty are different.
4. Big City: Some Already Have Tenants, While Others Still Need to Find Them
Bolshoy City cannot be viewed as a single tower with a uniform price and uniform demand. Within it, an established business center coexists with areas where a fully-fledged urban environment is still taking shape. We explored the geography of this expansion in more detail in our article on the development of Big City.
In the heart of Moscow City, a company gains a well-known address and an established business environment. New sites may offer other advantages: more modern layouts, proximity to employees’ homes, and the opportunity to occupy a large block. However, a future waterfront, pedestrian bridge, or public space cannot be evaluated in the same way as infrastructure that is already operational.
Below is a selection of projects illustrating different demand patterns. This is not a complete list of projects in Big City, nor is it a ranking of investment attractiveness. The timelines are as stated, and project specifications are subject to change.
| Project | Stated Time Horizon | What Is Known About Demand and What It Means |
|---|---|---|
| The tower near the Bagration Bridge, the future headquarters of RVB | 2030; timeline from the transaction announcement | RVB has publicly announced the purchase for use as its own headquarters. This is a specific end-user, not merely a bet on future leasing. Construction risk remains. |
| “CITY 4,” Sezar Group | 2027; the developer’s catalog lists the third quarter | The Moscow Exchange’s purchase of the offices has been confirmed by the parties to the transaction. This demand supports the acquired portion of the complex; it cannot be automatically extrapolated to the entire property. |
| TOP TOWER, MR | Q4 2029, according to the MR Office website | 97,000 square meters of office space have been announced. There is a public offering, but it is not possible to determine the proportion of future tenants and investors from it. |
| ONE, MR | Q2 2030, according to the MR Office website | The website lists 72,000 square meters of office space. To assess future leasing potential, a breakdown of sales by purchase purpose is needed, rather than just the overall sales percentage. |
| CAESAR TOWER, Sezar Group | 2030, according to an NF GROUP study for the first half of 2025 | The official website confirms the project’s existence; the historical timeline from the study needs to be updated. There is insufficient public data on the full allocation of space to end users. |
| STONE Mnevniki 1, 2, and 3 | 2028, 2029, and 2030 by phase | The developer reports that nearly 100% of the first phase has been sold and more than half of the offices in the second phase. This is evidence of sales based on the seller’s statement, but not proof of future full occupancy. |
Sources: RWB statement via Interfax, confirmation of the transaction by the Moscow Exchange in RBC, Sezar Group catalog, MR Office, SEZAR TOWER, NF GROUP overview, STONE Mnevniki.
What Kind of Protection Actually Works
The most straightforward scenario is when a well-known company acquires space to house its employees. This reduces the risk that, once the facility is completed, the owner will have to start from scratch to find a tenant. However, construction timelines, fit-out costs, and potential changes to the company’s own plans remain factors to consider. There is no such thing as complete invulnerability.
Another level of assurance comes from lease agreements for future spaces. Here, the term, security mechanisms, and exit clauses are crucial. The mere announcement of negotiations carries less weight than a signed commitment. A reservation is also not the same as a completed transaction.
There is a specific rationale behind an investor’s purchase of a small unit. The developer gains a buyer, and the rental market gains a potential new landlord. If such owners put their properties on the market at the same time, high occupancy rates in a building may be accompanied by a lengthy search for tenants. There is no contradiction here: the space has been sold but has not yet been occupied by a business.
Where Vulnerability Is Greater
A model is more susceptible to a market slowdown when several conditions coincide: there is no confirmed end-user; a significant portion of the space has been purchased for sublease; the space is being delivered unfinished; direct competitors are being built nearby; and transportation accessibility depends on future construction projects.
It would be incorrect to label a specific tower as “doomed” based on these general characteristics. Such a conclusion would require data on financing, contracts, and actual sales—information that is rarely disclosed in full. However, the issues listed above do help us understand what evidence is missing from a polished presentation.
Even today, it’s helpful to look not only at the overall vacancy rate but also at the available offerings: the size of the contiguous space, finishes, utility infrastructure, and the timeline for gaining access to the space. We’ve published a separate analysis of the Moscow City market explaining why an increase in available square meters can coexist with a shortage of suitable office spaces.
Ground floors are also important for the district itself. A restaurant or service business needs a daily flow of employees, not the number of office units sold on the upper floors. It may take time between a tower’s completion and the emergence of this flow. This is yet another reason to assess the development of Bolshoy City based on occupancy rates, rather than just construction photos.
5. Three Scenarios Through 2030
The future depends on two factors: how quickly space becomes available and how quickly businesses begin to occupy it. The following scenarios are an editorial model, not a broker’s numerical forecast. We do not assign probabilities to them nor do we promise any specific rate of return.
Scenario One: Gradual Occupancy
Some deadlines are pushed back, and new phases are completed sequentially. Companies are expanding and consolidating their divisions; large tenants secure suitable spaces before they are even completed. Offices with reasonable fit-out costs find tenants without long delays.
For Big City, this scenario means a gradual expansion of the business environment. New districts have time to develop their infrastructure, and demand is distributed across the phases. However, some unsuitable spaces may remain vacant even in a favorable market.
Indicators: sustained positive net absorption, signing of leases with end-users, and a shorter time to find a tenant after a building is completed. Rising asking rents alone do not confirm this scenario.
Scenario Two: Two Different Markets Side by Side
Modern buildings with convenient transportation access and properties with corporate tenants are filling up, while some new, unfinished office spaces remain on the market for extended periods. Owners compete on the terms of renovations, rent-free periods, and lease flexibility. The average rent may remain high despite this.
This disparity is particularly easy to imagine in Big City: one address is already integrated into business life, while the neighboring one has yet to prove its suitability for day-to-day operations. Even within the same tower, a finished floor and scattered, unfinished spaces will be in demand to varying degrees.
Signs: a widening gap between the asking price and the terms of the deal, a noticeable spread of vacancies across buildings, and the emergence of additional concessions instead of an official price reduction. This is precisely the scenario that deserves close attention: it requires neither a general collapse nor an endless shortage.
Scenario Three: Completion Outpaces Occupancy
Several large projects and development phases are nearing completion almost simultaneously, while companies are cutting their budgets for relocations and expansion. Investors put their purchased units on the market, face competition from neighboring companies, and begin to offer price concessions or finance the finishing work at their own expense.
The pressure extends to the existing building stock as well: some tenants are moving to new buildings under more favorable terms. In this scenario, Bolshoy City benefits as an area undergoing renewal, but individual property owners may face prolonged vacancies. The success of the district and the income of each owner are two different things.
Signs: the number of new buildings coming online for several quarters in a row exceeds the growth in occupied space; the time on the market is increasing; subleasing is on the rise; and the number of fully finished units—for which tenants still have to negotiate—is growing. A standardized methodology is needed for assessment; otherwise, a change in the sample could be mistaken for a market turning point.

Editorial scenarios: gradual occupancy, market segmentation, and a surplus of available space. These are trends, not projected vacancy rates.
There’s a simple way to avoid getting lost in forecasts: once a quarter, compare actual new supply, net absorption, and vacant space ready for occupancy, and for a selected project, verify the end users separately. A calendar of commitments is useful, but the real result is evident when someone turns on the lights in an office and starts working there.
For Bolshoy City, the construction boom opens up the opportunity to become a more diverse business district—with different office formats and new points of attraction. The risk lies where future demand is being substituted by real estate sales that have already taken place. Therefore, the key question regarding the new tower is not “how many square meters will be built?” but “which company will occupy these square meters, under what terms, and when?”