

0px) {
.mcg-office-autumn-2026 .mcg-table-scroll table {
min-width: 600px;
font-size: 13px;
}
.mcg-office-autumn-2026 .mcg-table-scroll th,
.mcg-office-autumn-2026 .mcg-table-scroll td {
padding: 10px;
}
.mcg-office-autumn-2026 .mcg-table-scroll th:first-child,
.mcg-office-autumn-2026 .mcg-table-scroll td:first-child {
min-width: 130px;
}
}
New towers are under construction at the business center’s building sites. Transaction statistics tell a different story: companies are increasingly choosing offices in other areas of Moscow. According to IBC Real Estate estimates, the vacancy rate in “Moscow City” has risen from 3.3% to 6% since the beginning of 2026, while the cluster’s share of transactions has fallen from 8% last year to 3% this year. Meanwhile, six projects within the Moscow International Business Center (MIDC) have announced an additional 538,000 m² of office space to be completed by 2031.
It looks like a clash between construction and demand. But the headline “The City Is Emptying Out” would be too simplistic an explanation: consultants calculate vacant square meters differently, sales of office space do not equate to occupancy, and most of the future space has not yet been built. In our August analysis of office vacancies and shortages, we already highlighted the impact of Moscow Towers on the overall statistics. Now that the September figures are in, we can take a closer look at the new transactions.
The turnaround: 6 percent or less than 3 percent?
Vacancy rate—the proportion of completed office space that is vacant and available on the market. This is a snapshot of the existing stock as of a specific date. Floors under construction are not included. But even for completed buildings, the total depends on which buildings and office classes are included in the sample.
| Assessment | Indicator | What is known |
|---|---|---|
| IBC Real Estate | 3.3 → 6% starting in early 2026 | Valuation for “Moscow City,” published on September 28. |
| CMWP | 2.4 → 2.7% year-to-date | Prime, A, and B-class properties in the Moscow International Business Center (MBDC); as of September 24. |
| Nikoliers | 1.8% | The “Old” City in the September study, not the entire cluster. |
Both September estimates show growth, but do not confirm the same growth rate. There is no public reconciliation of building lists and accounting rules between IBC and CMWP; the 6% and 2.7% figures cannot be averaged. Another figure that’s easy to misinterpret is 1.3%: IBC attributed it to March 2025, not the beginning of 2026. The sequence “1.3 → 6% over nine months” is therefore incorrect.

Moscow Towers: a tall tower and an overly large lot
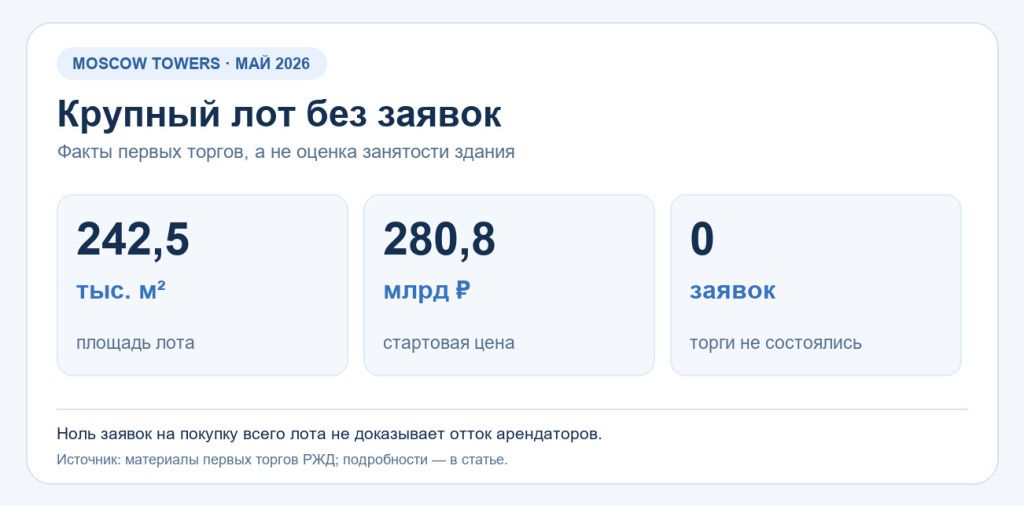
The story of Moscow Towers illustrates the problem from another angle. Russian Railways purchased part of the premises in 2024 to house its own divisions, then decided to put the asset up for sale. At the first auction in May 2026, a lot with an area of 242,500 square meters was put up for sale with a starting price of 280.8 billion rubles. No bids were received. For more details on the procedure, see the portal’s news article on the failed sale of Moscow Towers.
This is a clear indication of the challenges involved in a transaction of this scale under the proposed terms. However, the lack of bids for the entire lot does not mean that tenants are leaving the neighboring towers en masse. For statistical purposes, the building’s future is important: a single large tenant could occupy the space all at once; selling or leasing it in separate blocks would prolong the occupancy process. In June, Russian Railways (RZD) reported that it would use the results of the first auction to make further decisions.
Where Are New Transactions Heading?
According to IBC Real Estate, Moscow City’s share of transactions fell from 8% in 2025 to 3% in 2026. Outside the Third Transport Ring, by contrast, the share rose from 51% to 58%. This refers to the distribution of new transactions across the city, not a count of companies that have moved out of Moscow City.
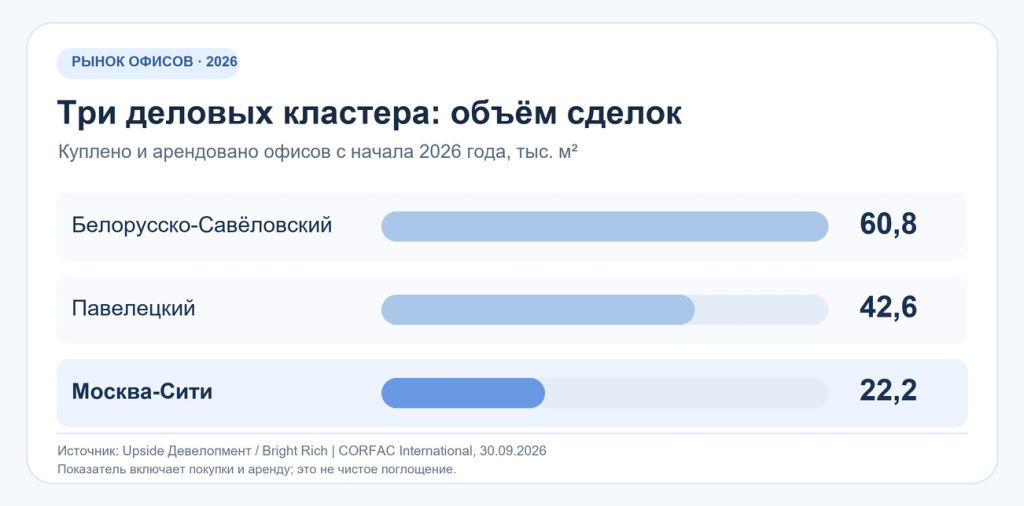
Another snapshot from September comes from a study by Upside Development based on data from Bright Rich. Since the beginning of the year, 22,200 m² of office space has been purchased and leased in the Moscow International Business Center (MBDC). Among the districts cited for comparison, this is the smallest volume: in the Belorussko-Savyolovsky cluster—60,800 m²; in the Paveletsky cluster—42,600 m². These figures include both sales and leases. This result cannot be described as “net absorption” or as the lowest among all of Moscow’s business districts.
The picture is not entirely one-sided. According to Asseto, sales of commercial properties in the City rose 51% year-over-year in the first half of the year, reaching 15,100 square meters. This is a different period and a different set of transactions than those included in the September assessment of purchased and leased offices. The situation in the capital is also mixed: sources speaking to “Kommersant FM” mention an average office transaction size of about 500 m²—down from approximately 1,000 m² prior to 2022—and tenant requests for a 20–25% discount. These figures apply to Moscow as a whole; the requested discount does not yet mean an agreed-upon rate in “Moscow City.”
Construction vs. Demand
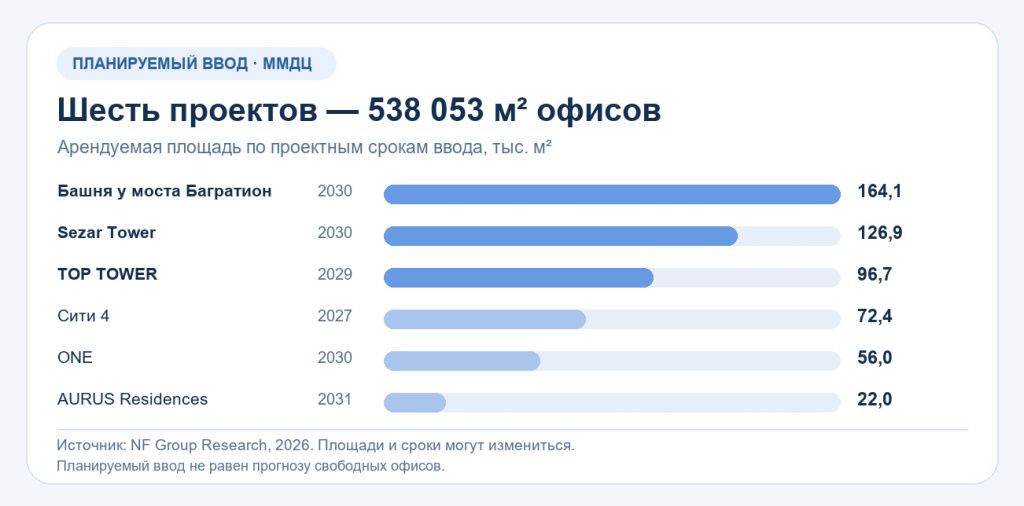
According to NF Group’s estimates, six projects located directly within the Moscow International Business Center (MBDC) could add 538,053 m² of leasable office space between 2027 and 2031. The three largest projects are the tower near the Bagration Bridge (164,100 m²), Sezar Tower (126,900 m²), and TOP TOWER (96,700 m²). Together, these account for approximately 388,000 m². Timelines and projected areas are subject to change.
538,000 m² represents planned completions, not a forecast of vacant office space. Some of the space in new buildings is sold to future tenants even before completion. When an owner moves into their own office, that space is added to the inventory but does not appear on the open rental market. Estimates differ for the broader Bolshoi City area: it cannot be combined with the boundaries of the Moscow International Business Center (MIDC) in a single chart.
There is also a risk of delays. IBC Real Estate and October Group analyzed 31 office projects under construction in Moscow totaling 882,000 m², scheduled for completion in 2028. Fifteen projects totaling 239,000 m² are reported to be well on track; the timelines for the remaining 16 raise questions. These 882,000 square meters refer to all 31 projects across Moscow, not just the 16 at risk and not just Bolshoi City. A delay in completion changes the supply timeline but does not automatically create a shortage.
When the market finds equilibrium
Open-source research does not provide an exact date for the turnaround at the Moscow International Business Center (MIBC). At the end of August, MR Commercial Real Estate Director Kermen Mastiev attributed the office market’s difficulties to the overall economic situation and expected an increase in transactions as conditions improved. No specific forecast regarding rental rates or vacancy rates for the City can be derived from this comment.
Three observations are important in upcoming reports: the vacancy rate within the same sample of buildings, the volume of new transactions in square meters, and the share of future office space already allocated to tenants. A separate issue is the decision regarding Moscow Towers. If the new towers are delivered with buyers and tenants already secured, the vacancy rate could stabilize even amid intensive construction. If the volume of transactions remains low, the time required to find tenants for individual blocks will increase. These are scenarios, not a promise of price reductions.
As of early October, data from individual consultants confirms a shift in new transactions toward other locations and a rise in vacancy rates. The figures cited do not indicate a mass exodus of current tenants from “Moscow City.” For those choosing an office now, it is more useful to look at offers for a specific tower and the terms of the lease agreement than at a single average rate for the district; we have analyzed the range of rates and formats in our practical overview of office leasing.